 Skip to content
Carbon Footprint Labelling: Is This The Future Of Supermarket Shelves?
Carbon Footprint Labelling: Is This The Future Of Supermarket Shelves?
As the climate emergency rages on, it has never been more important for consumers to think twice about their carbon footprint and in particular, the impact their diet and weekly food shop choices are having on the planet.
According to a 2019 report from the IPCC, the process of producing, processing and transporting our food to our tables is responsible for up to 37% of total global greenhouse gas emissions.
While we are often told how every item we pick up from the supermarket shelf can have a lasting impact, many of us will have little idea what that impact actually is. With so much information available, it can be difficult for consumers to see what is actually being done by manufacturers and retailers to reduce emissions.
Here at Ashbury, we wanted to take a look at what the future of carbon footprint labelling might look like in years to come.
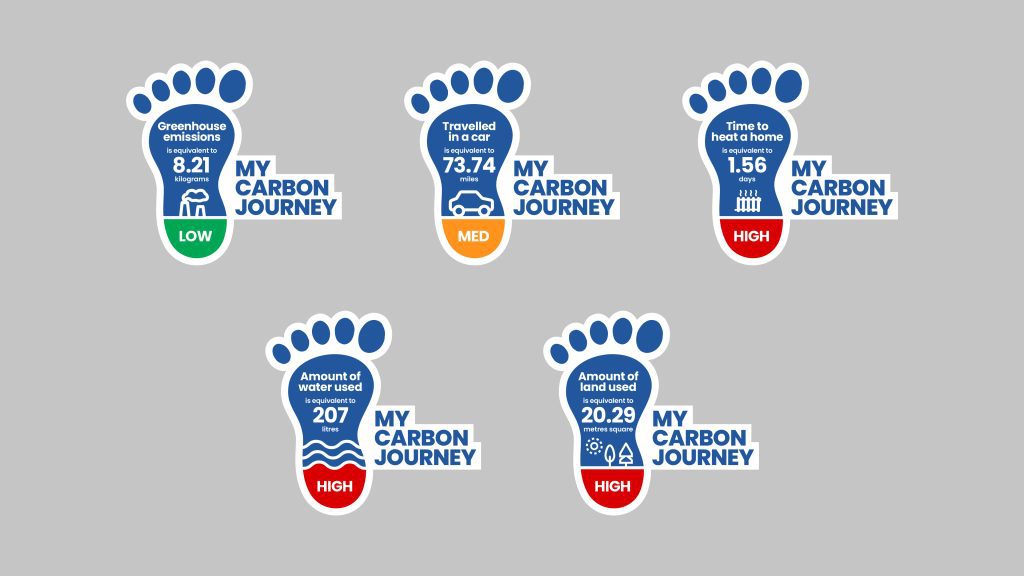
Table of Contents
Industry Insight: What is being done to reduce emissions and is there a demand for more transparent labelling?
While many food and beverage companies are now working towards carbon-neutral products, there is still some way to go for the industry, and this goes all the way from production through to product marketing. The industry as a whole, from regulators to businesses are still learning how to navigate compliance across the supply chain, including food labelling compliance specifically. It isn’t easy to get right and can be a real resource drain for brands and retailers.
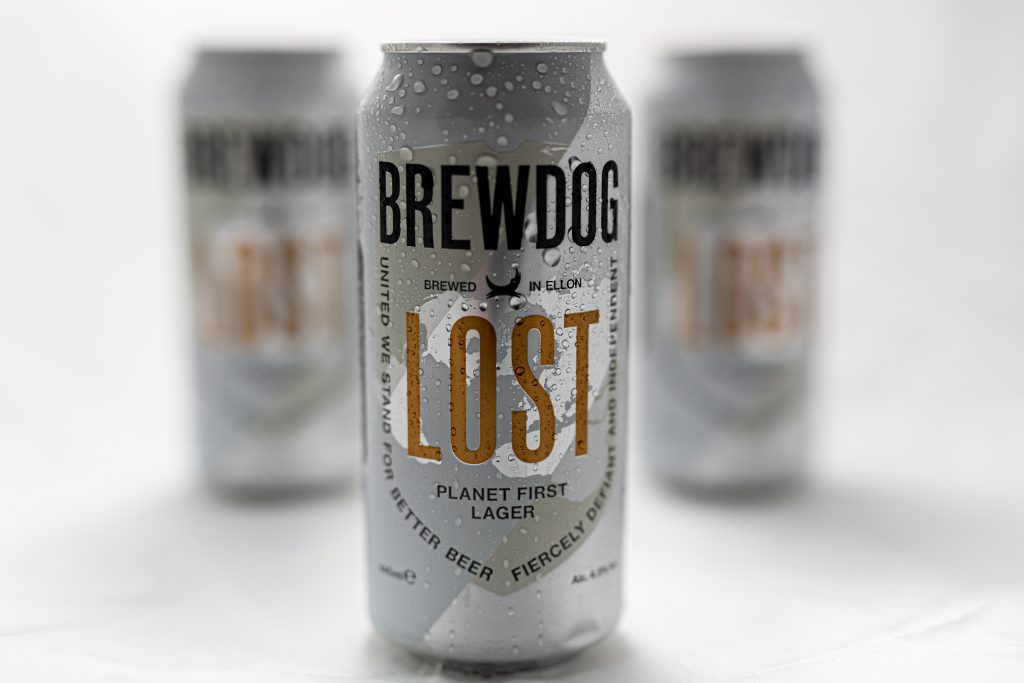
Take the brewing industry for example, industry rebels Brewdog became a carbon-negative brewery in 2020 – the first beer business to do so – with a range of breweries across the globe following suit since, sustainability has become a major focus for some of the bigger players in this market.
In the UK the appetite towards a more-carbon-friendly future appears to be turning after a recent YouGov survey found more than half of all young adults think they would eat a more carbon-friendly diet should carbon footprint labelling be introduced in the UK.
Climate trends don’t stop there, with other notable examples including regenerative agriculture, packaging made from fungi and even carbon neutral dairy ice-cream produced from cows who eat methane-reducing feed. These, among various other carbon offsetting schemes, showcase the monumental efforts across the food and beverage supply chain to reduce environmental impact.
But despite this, it’s clear that while many within the food and beverage industry are taking the proper steps, more could be done to inform consumers about the impact of their choices. And with the EU knuckling down on the use of carbon claims and labelling, there’s not just moral motivation to consider, but legal obligation too.
The future of carbon food labelling
Labelling has often had to fight its corner with brands continuing to face challenges in finding a model that works. The traffic light labelling system is just one of those, with the voluntary scheme introduced by the government in 2007. While not mandatory, the system provides consumers with a transparent view of what they are eating which raises the question: Could carbon labelling be provided in a similar manner to make the picture clearer for consumers?
Learn More: Traffic Light Labelling: A Guide For Food Businesses
Carbon footprint labelling is already making an impact on the food industry with restaurants and even Universities, already trialling carbon food menus and labels. In particular, businesses like Klimato, work with restaurants to provide diners with an option of seeing what impact their menu choice will have on CO2 emissions.
We have already seen trials of this system on supermarket shelves with businesses like Quorn having trialled carbon food labelling back in 2020 and yet three years on, the demand for a more transparent labelling system seems to be growing.
The ‘Eco-Score’ also gained media attention in 2021, when it launched in France. Like the Nutri-Score concept, it gives products a score out of 100, with colour coding from red to green and letters to communicate this score to consumers. The lower the score, the less sustainable the product.
In the UK, high-growth brand My Emissions has developed a tech solution that enables brands to calculate, reduce and carbon label their food based on emissions from farm to store. The resulting carbon rating uses colours and letters to communicate to consumers and empower product comparisons, such as a meat-based curry vs a veggie one.
Of course, all of these approaches could work, but what else could we see from the future of food labelling for our household favourites as we adopt carbon footprint labelling?
It’s a question that comes up often within our team of food regulatory consultants, so we decided to get creative to find out. We took 30 popular food items found in the average household and used the BBC’s Climate Change Food Calculator to establish the amount of CO2 per kg emitted for a portion of food. We then used this information to work out the emissions per standard quantity of food in a typical package size a consumer might pick up at their local supermarket.
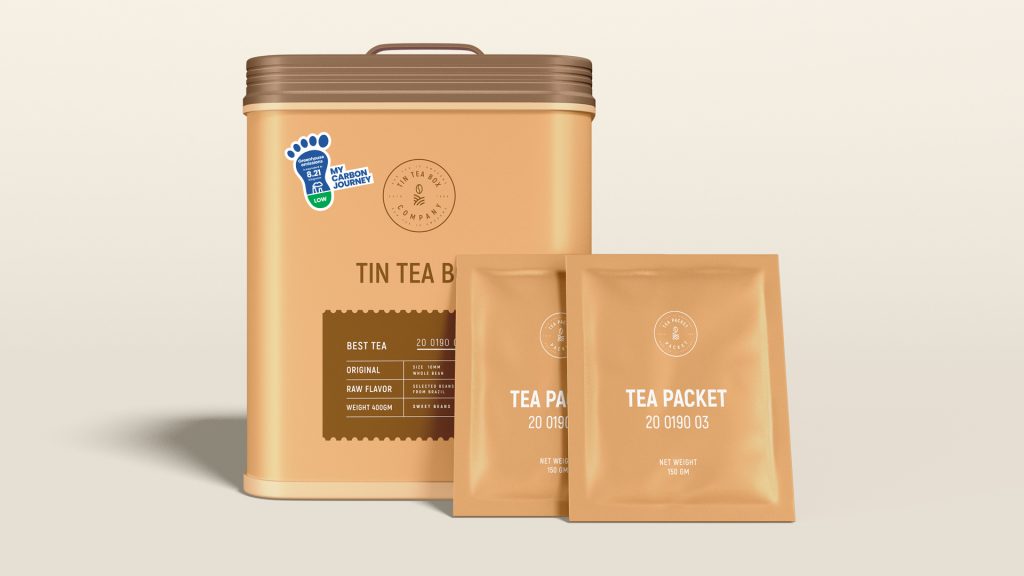
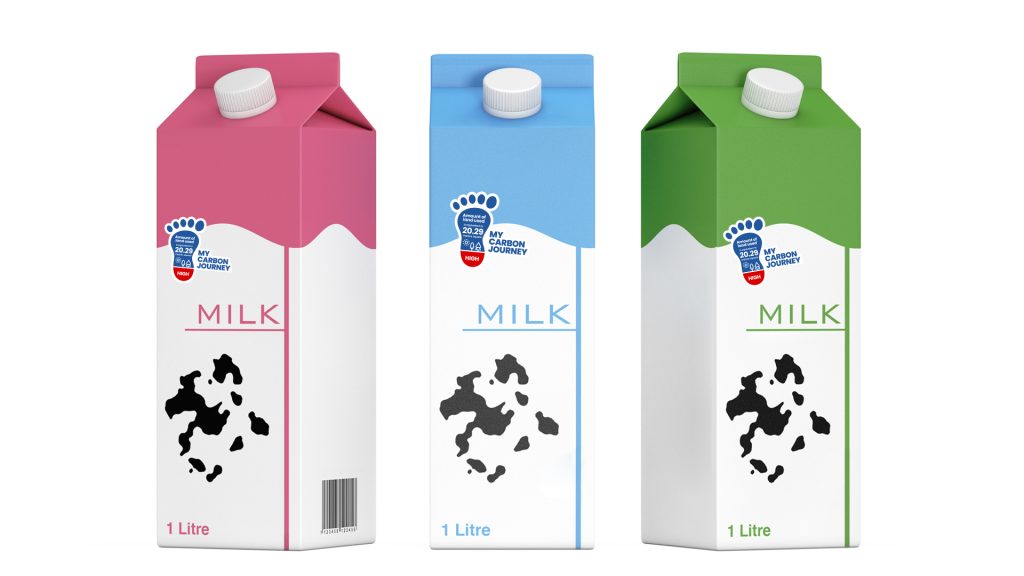
We also used figures from the calculator to establish what these emissions would look like in another form that might be more tangible for everyone to understand; number of miles travelled in a petrol car, number of days heating an average UK home, litres of water used / number of showers lasting 8 minutes and the equivalent in square metres of land used. To produce the image prompts, we used AI image generator tool Midjourney to provide some inspiration for our design team to mock up the label designs e.g. ‘create an equivalent value food label displaying x grams of carbon emissions’.
The resulting data is based on using one source and may vary depending on what data source you use to measure, which is a major challenge in itself when it comes to measuring sustainability.
| Food | Portion Size | Standard retail Pack | CO2 emissions produced per standard pack (kg) | Miles Driven in Car (per standard quantity) | Days heating home (per standard quantity) | Litres of water used / Number of showers per year | Equivalent in square metres of land used (for reference, a football pitch is 7,140m2) |
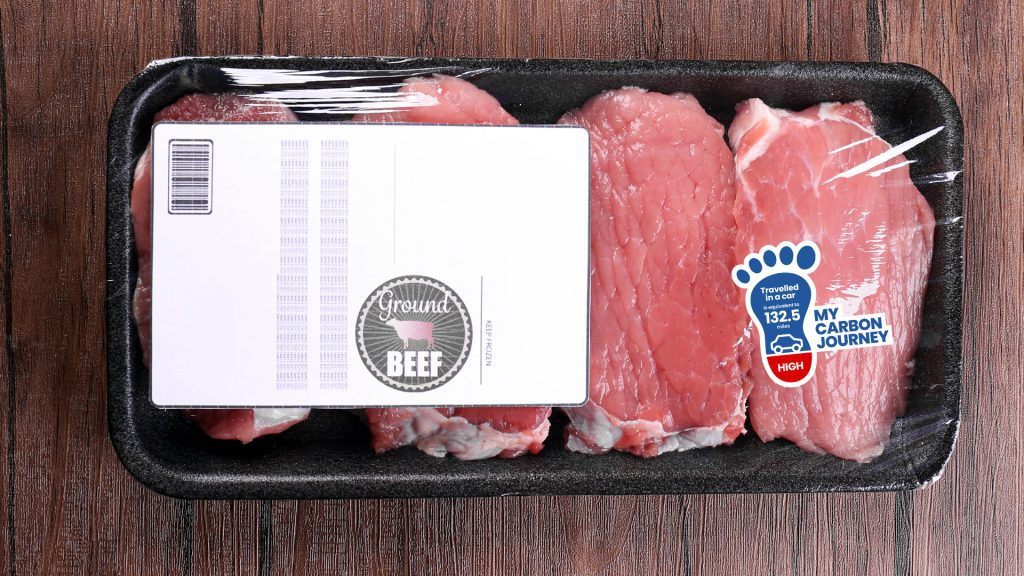
| Beef | 75g | 500g | 51.53 | 131.43 | 8.164 | N/A | 147.8m2 |
| Cheese | 30g | 400g | 12.80 | 32.84 | 2.145 | 3,021 litres used / 46 showers lasting 8 minutes | 47.3m2 |
| Chocolate (Dark) | 70g | 200g | 4.23 | 10.81 | 0.665 | 71 litres / 1 shower lasting 8 minutes | 5.72m2 |
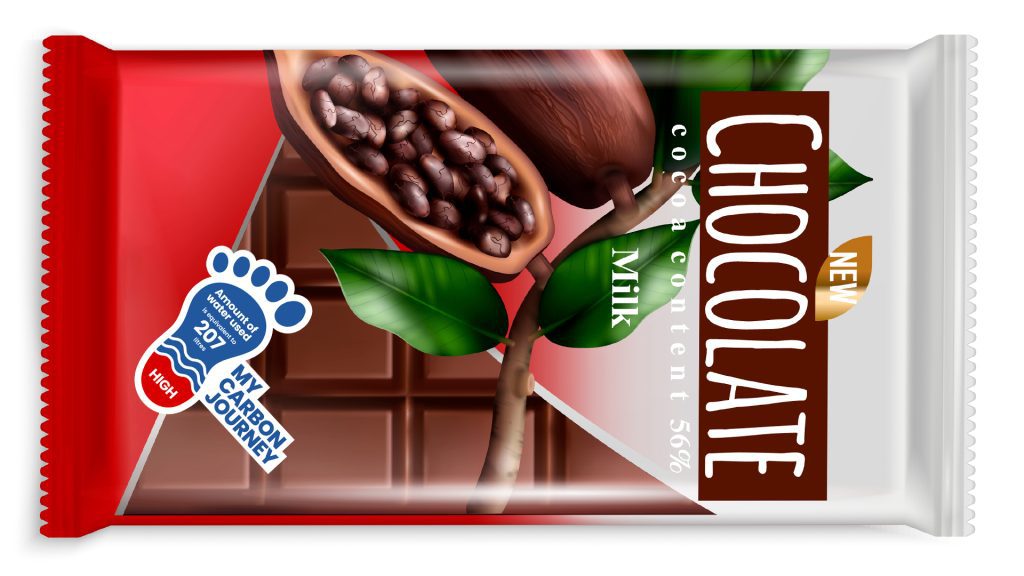
| Chocolate (Milk) | 70g | 200g | 2.94 | 7.49 | 0.462 | 207 litres / 3 showers lasting 8 minutes | 5.30m2 |
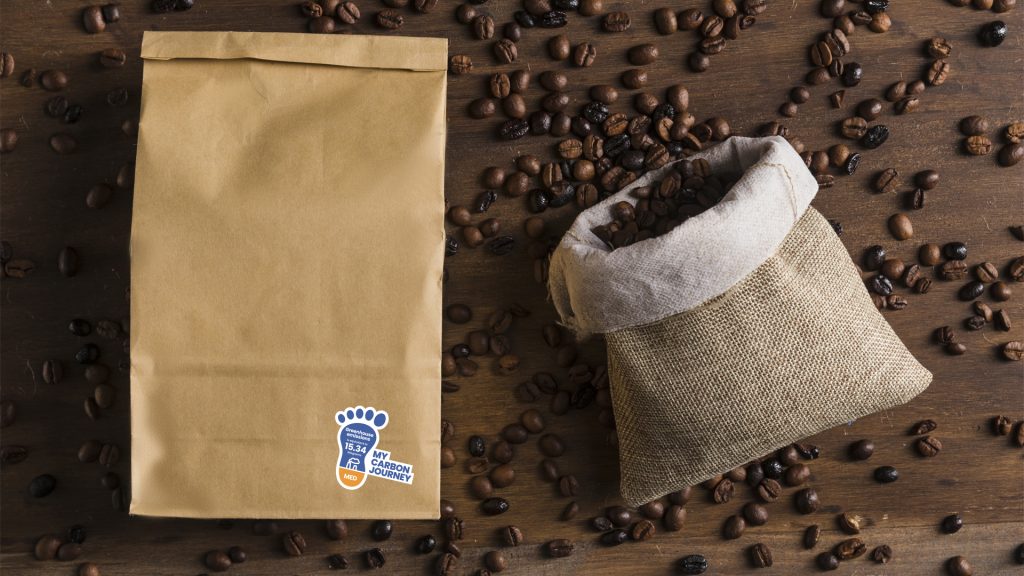
| Coffee | 8.3g | 300g | 15.34 | 39.31 | 2.376 | NA | NA |
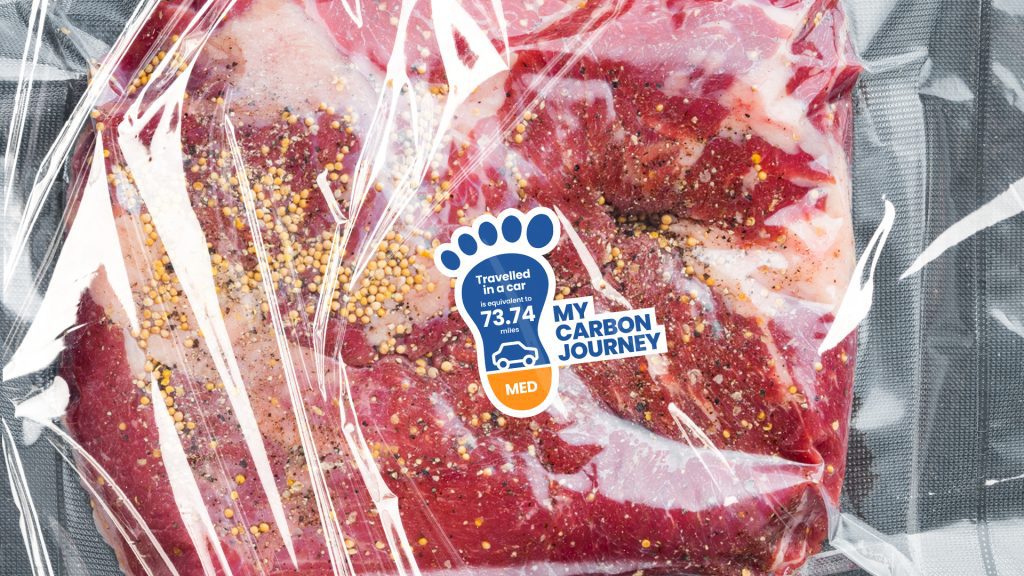
| Lamb | 75g | 500g | 28.87 | 73.74 | 4.584 | NA | 269.1m2 |
| Milk (dairy) | 200ml | 2.272l | 7.13 | 18.20 | 1.120 | 1,423 litres / 22 showers lasting 8 minutes | 20.29m2 |
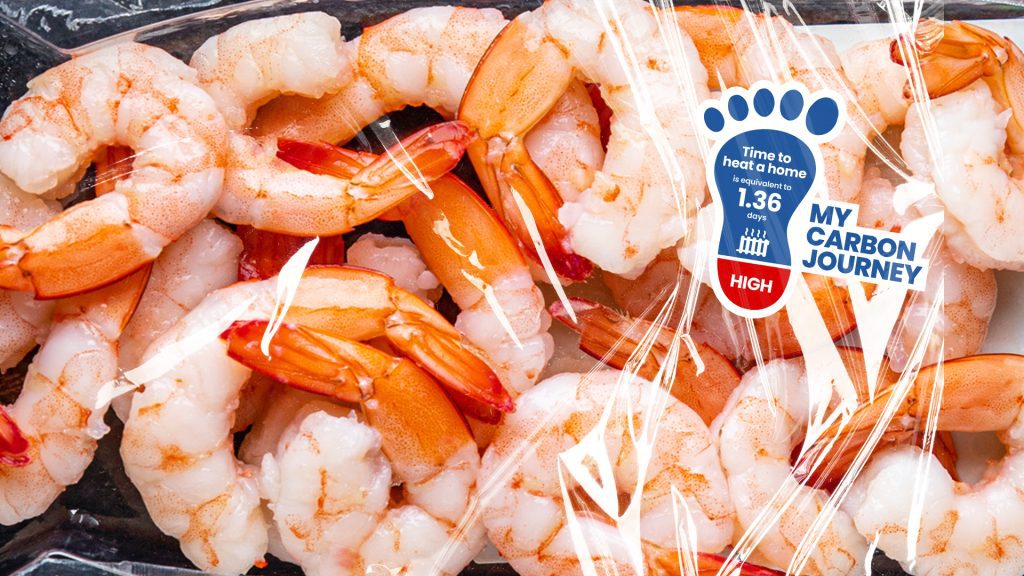
| Prawns | 60g | 150 | 8.6 | 21.96 | 1.36 | 1,126 litres used / 2,529 showers lasting 8 minutes | NA |
| Rice (uncooked) | 33.33g | 1kg | 9.90 | 25.48 | 1.562 | 505 litres used / 8 showers lasting 8 minutes | NA |
| Tea | 1 bag | 200 tea bags | 8.21 | 21.36 | 1.095 | NA | NA |
What could the future of carbon footprint food labels look like?
We took 30 popular food items found in the average household and used the BBC’s Climate Change Food Calculator to establish the amount of CO2 per kg emitted for a portion of food. We then used this information to work out the emissions per standard quantity of food.
The resulting calculations were then used to establish what these emissions would look like in other forms; the number of miles travelled in a petrol car, number of days heating an average UK home, and litres of water used / number of showers lasting eight minutes.
Of course, there are pitfalls of using AI to produce these prompts. For example, while the existing nutrition focussed traffic light score is standardised (i.e. a score that gives a red sticker is calculated the same across any version of the label), the different equivalence comparisons in our examples could limit the comparison of one product to another e.g. litres of water vs miles driven.
The fundamentals of a good label are legibility, consistency and comparison – so consumers should focus on the ‘traffic light’ aspect of our labels for the comparison, and use the equivalence statement to understand this in a more tangible way.
Finally, the best way forward is one way forward. A single, standardised route across the industry. So whatever the future holds, we hope to see harmonisation.
How can subtle dietary changes make a difference?
The battle of the meats
A simple switch of your choice of meat for a Sunday roast could make a difference in your carbon footprint over time. Beef has traditionally been found to be one of the leading causes of greenhouse gases, along with other meats. According to the BBC’s calculator, the emissions created by producing a 500g pack of beef is equivalent to driving 131.43 miles by car and could heat the average home for 8 days.
By comparison, chicken is more than five times cheaper to produce in terms of emissions, with an equivalent 500g pack of chicken releasing 9kg of greenhouse gases; the same as driving 23.2 miles by car.
Lamb has also been known to be a key contributor of greenhouse gases with the emissions created by producing a 500g pack equating to driving a petrol car for 73.74 miles and could also heat a home for four days. In total, a 500g pack emits 28.87 kg of greenhouse gases. On the other hand, pork was also a big hitter, with a 500g pack contributing 12 kg of greenhouse gases.
But there is another side to the coin.
Simply dismissing meat in the name of carbon neutrality will be a bitter pill to swallow for the farming community with many farmers taking alternative steps to reduce the carbon footprint of production. One carbon neutral farm based in Devon/Cornwall has made significant changes to it’s farming processes to ensure their carbon footprint is kept at an absolute minimum, from implementing herbal and legume crop rotations so that the need to buy in chemical fertiliser is eradicated, to only breeding their own cattle with the benefit of reduced road miles.
One other viewpoint from the farming community is that some farmers are now removing more greenhouse gases than they emit through a process of carbon sequestration with between 63% and 118% of on-farm agricultural emissions being offset by properly managing pastureland that has the right mix of grass and other native vegetation.
Farmers are adapting to the need to live in a carbon neutral world, not fighting against it.
So, how can consumers make an informed choice when it comes to supermarket shelves? While most of us will be oblivious to the implications of picking up our standard pack of beef mince, a carbon footprint label could help improve transparency and allow consumers to make more informed decisions.
Milk chocolate vs dark chocolate
When it comes to our snacks and sweet treats, a simple swap could have a huge impact. Milk chocolate in particular has a significant carbon footprint and this will hardly come as a surprise when the logistics of producing and transporting it is taken into account. Using the BBC calculator, a 200g bar is the equivalent of using 207 litres of water or having three showers lasting eight minutes.
The production of dark chocolate, on the other hand, still plays a big role in greenhouse gas emissions with a 200g bar producing 4.23kg of greenhouse gases. That’s equivalent to using 71 litres of water.

While the two products above share a responsibility in the production and logistics of cocoa, the separating factor is the milk used in milk chocolate production. Naturally, the emissions produced from needing to keep cows and produce the milk needed for chocolate production, in addition to an extra step in the supply chain processaddso adds significantly to the carbon footprint of the milk chocolate offering.
Dairy milk and the alternatives
Dairy milk has long been a household essential for households across the UK and has taken some persuasion for consumers to start exploring alternative dairy-free milk. But with such a wide range now available to consumers, just how much better are dairy-free alternatives for the planet?
Dairy cows by their nature are big polluters, releasing high quantities of methane into the atmosphere. Dairy milk, unsurprisingly, is the biggest contributor to greenhouse gases from the milk category, with a 2.227 litre carton producing 7.13 kg of greenhouse gas emissions. This is equal to having 22 showers lasting eight minutes and using 20.29m2 of land.
The lowest emitting alternative milk is Almond milk, producing just 0.69 kg of greenhouse gases, equating to driving a petrol car for just 1.78 miles. It’s important to note that while Almond milk has a more favourable carbon footprint, it does use up to 20 times more water to produce than dairy milk.
It’s important to note that measuring carbon isn’t always the be all and end all, with Almond Milk being a prime example of this, how much water is used to produce products, as well as an array of other factors, also need to be taken into account, to give a more accurate picture of the implications our shopping choices are having.
Methodology
We took 30 popular food items found in the average household and used the BBC’s Climate Change Food Calculator to establish the amount of CO2 per kg emitted for a portion of food. We then used this information to work out the emissions per standard quantity of food.
The recommended serving size of which the BBC data was based, were from the British Dietetic Association (BDA) and healthy diet portion sizes from BUPA. The methodology does stipulate that these portion sizes are often lower than would be reasonably consumed, therefore, we converted the calculations to reflect standard pack sizes found in supermarkets.
We also used the resulting calculations to establish what these emissions would look like in other forms, based again on the figures from the BBC’s calculator; number of miles travelled in a petrol car, number of days heating an average UK home, and litres of water used / number of showers lasting 8 minutes.
Data may vary depending on sources used.
The prompts for each of these are images generated using AI image generation software: Midjourney
Data correct as of August 2023

Next reads

What’s Next for Food & Drink? Our Experts’ Predictions for 2026

The Peanut Diaries: School and Social Occasions
The Peanut Diaries: Navigating Social Events and Celebrations with Food Allergies
The Peanut Diaries: A Parent’s Journey to Uncovering their Child’s Allergy
Keep up to date with our latest insights
Subscribe to our mailing list to stay in touch with the latest news, insights and updates from Ashbury
